8. Charts and Distributions
Two panes look at the whole take, not just the last few seconds:
- Charts show each reading over time: rate, amplitude and beat error, from the take’s start to its end.
- Distributions show how each reading’s values spread, with time order left out.
Both start hidden. They open from Analysis in the icon bar, as tabs beside the Tick Tock Profile.
Charts
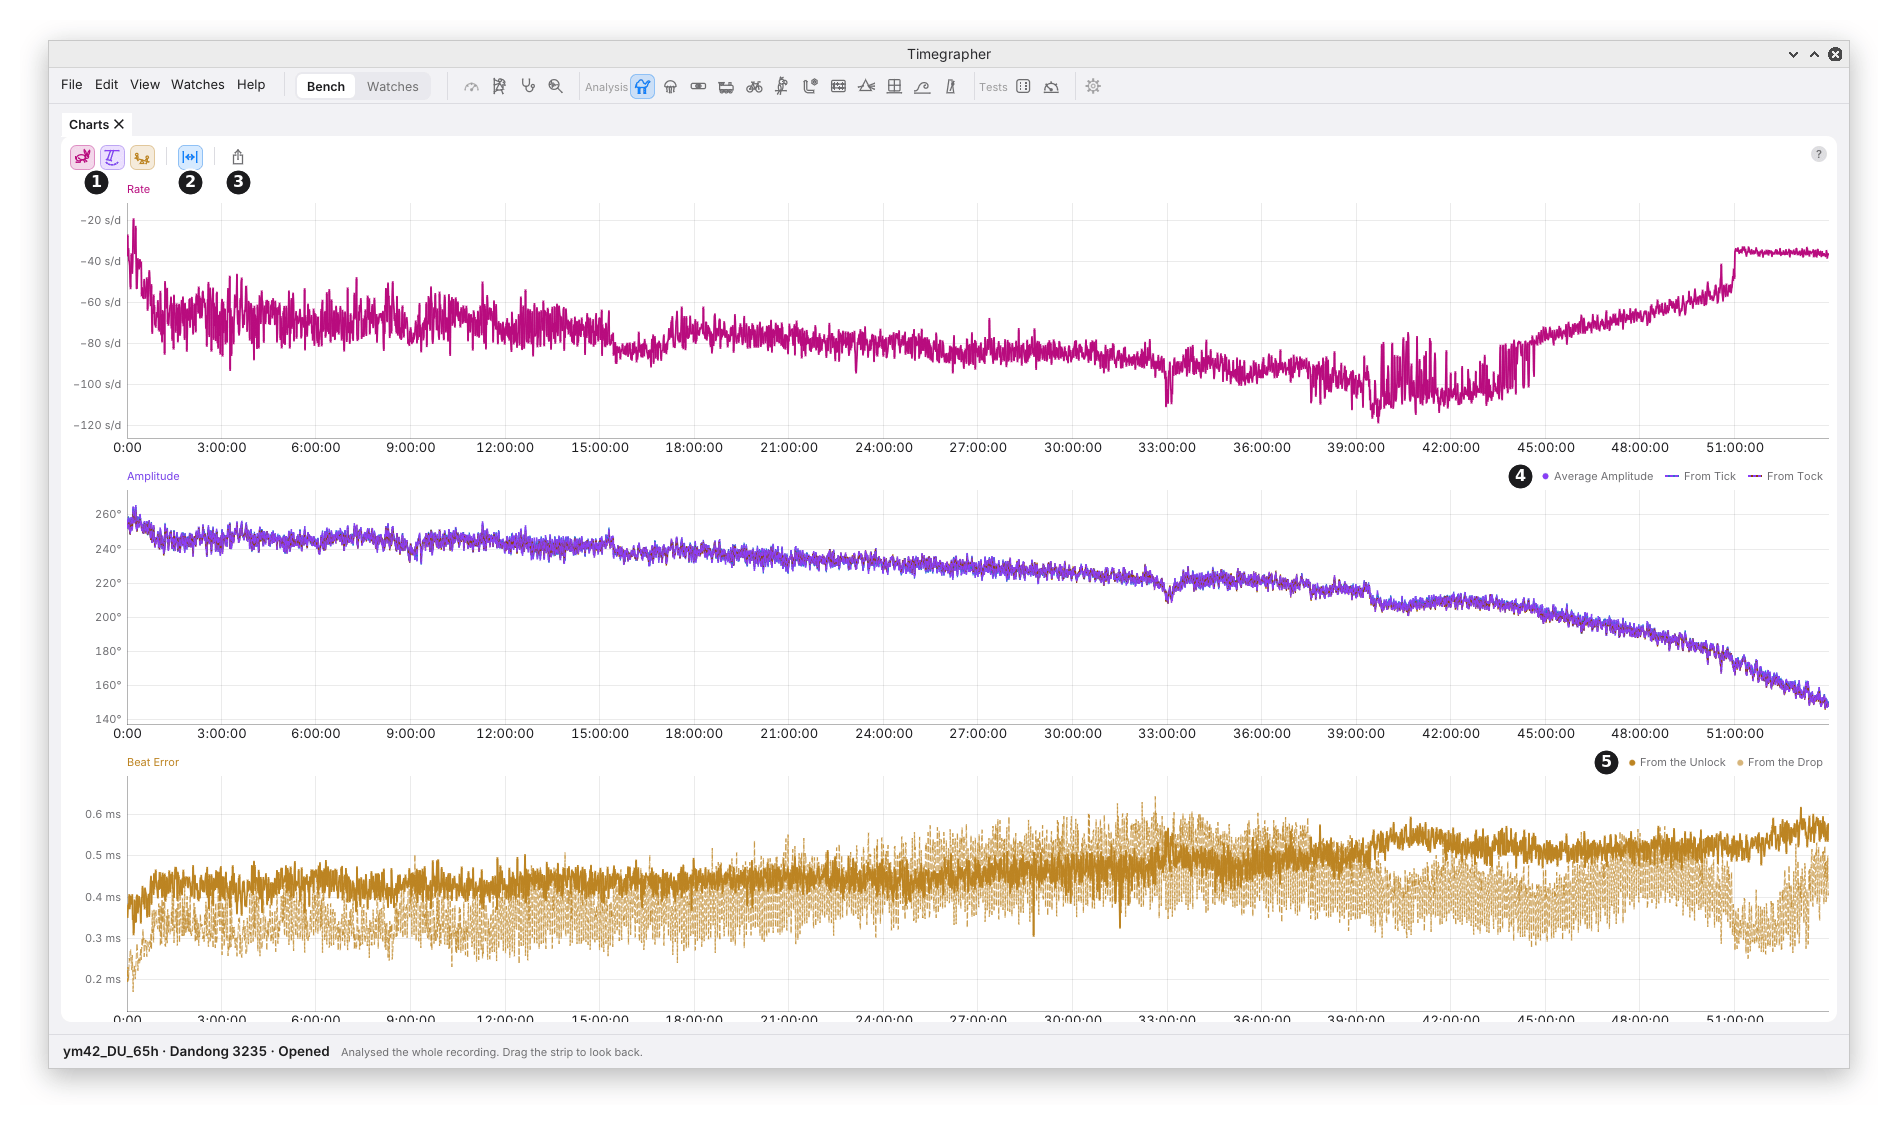
What it shows: one chart for each reading, stacked, all on the take’s time axis. 0:00 sits at the same place on every chart. With the Paper Strip lying across, it sits at the same place on the strip too.
Why you’d use it: a card gives the last reading. A chart shows the reading changing over the whole take, so you can see when something happened: after a turn, at a knock, as the mainspring runs down.
| Mark | Control | What it does | Why you’d use it |
|---|---|---|---|
| 1 | Rate, Amplitude, Beat Error (the hare, the swing and the seesaw) | Show or hide each chart. At least one stays on. The charts shown share the pane’s height. | Fewer charts give each more height. |
| 2 | Fit | On while the charts show the whole take. A pan or a zoom turns it off; turning it on shows the whole take again. | To get back to the whole take after zooming in. |
| 3 | Export… | Saves the pane as a picture, PNG or SVG. The pane’s name and the chart keys go at the top in place of the toolbar. | To share the charts, or put them in a report. |
| 4 | The Amplitude key | Average Amplitude, solid, and the amplitude From Tick and From Tock, dashed. | To see whether the two sides read alike. |
| 5 | The Beat Error key | Beat error From the Unlock, solid, and From the Drop, fainter and dashed. | To compare the two measurements of beat error (M5). |
In the picture is a Dandong 3235, fully wound and left dial up until it stopped, 59.8 hours later; the first 54 hours are shown, before the dying hours stretch the scales. Over them the amplitude falls steadily from about 255° to 145°, the mainspring letting down. The rate does not simply follow it: it settles near −65 s/d after the first hour, drifts to about −100 s/d by 42 hours, then climbs to about −40 s/d as the amplitude falls fastest. At about 15 hours the rate and the amplitude step down together, and at about 33 hours both dip and recover. Twice more the rate jumps on its own: at about 44 hours it climbs by some 20 s/d within an hour, and at about 51 hours it steps up by about 15 s/d at once, while the amplitude line runs on smoothly through both. A rate that moves with no change in amplitude points at something other than the mainspring; Isochronism’s Walk view (chapter 19) shows the same two jumps. These are moments a card read now and then would miss, and the places to look on the strip. The beat error from the unlock grows from about 0.4 to 0.55 ms. Isochronism (chapter 19) puts the rate against the amplitude directly, and the Power Reserve Test (chapter 21) gives the same run hour by hour.
The lines. Each reading keeps its colour across the app: rate magenta, amplitude violet, beat error amber. A second line of the same reading is told apart by its dashes. Beat error is charted as a size, as on its card.
The scale fits the lines on its own and holds every value, so no point is drawn off the chart.
Moving Around
| To | Do this |
|---|---|
| Read a moment | Point at it. A line marks that moment on every chart and on the strip. Each chart’s top lane gives every line’s value there, and the chart under the pointer gives the time too. |
| Pan | Scroll, swipe, or drag. Panning stops at the take’s start and its end, or now while listening. |
| Zoom time | Cmd or Ctrl and scroll, or pinch, around the pointer. |
| See the whole take | Double-click, or turn Fit on. While listening, the charts then follow new beats. |
| Find a moment on the strip | Click it. The strip and the readings go to it. |
All the charts pan and zoom together.
What to Look For
| What you see | What it can mean |
|---|---|
| A step in all three charts at once | The watch changed state: a turn, a knock, a change of wind. Check the strip and the track at that moment. |
| Amplitude falling slowly over hours | The mainspring running down (chapter 21). |
| The rate following the amplitude | A rate that depends on the swing (isochronism, chapter 19). |
| From Tick and From Tock apart, but steady | The two sides sound different. It doesn’t by itself mean the balance swings further one way (M4). |
| The two beat-error lines apart | The unlock and the drop give different beat errors (M5). |
Good to Know
- Changing Average Over or the lift angle works every point out again, back to the take’s start.
- The charts always cover the whole take. To look at a stretch, zoom in, or use the Paper Strip with its masks.
- A pane too short for every chart draws the first ones at a readable height and names the rest at its foot, such as “Beat Error not shown: no room”.
Distributions
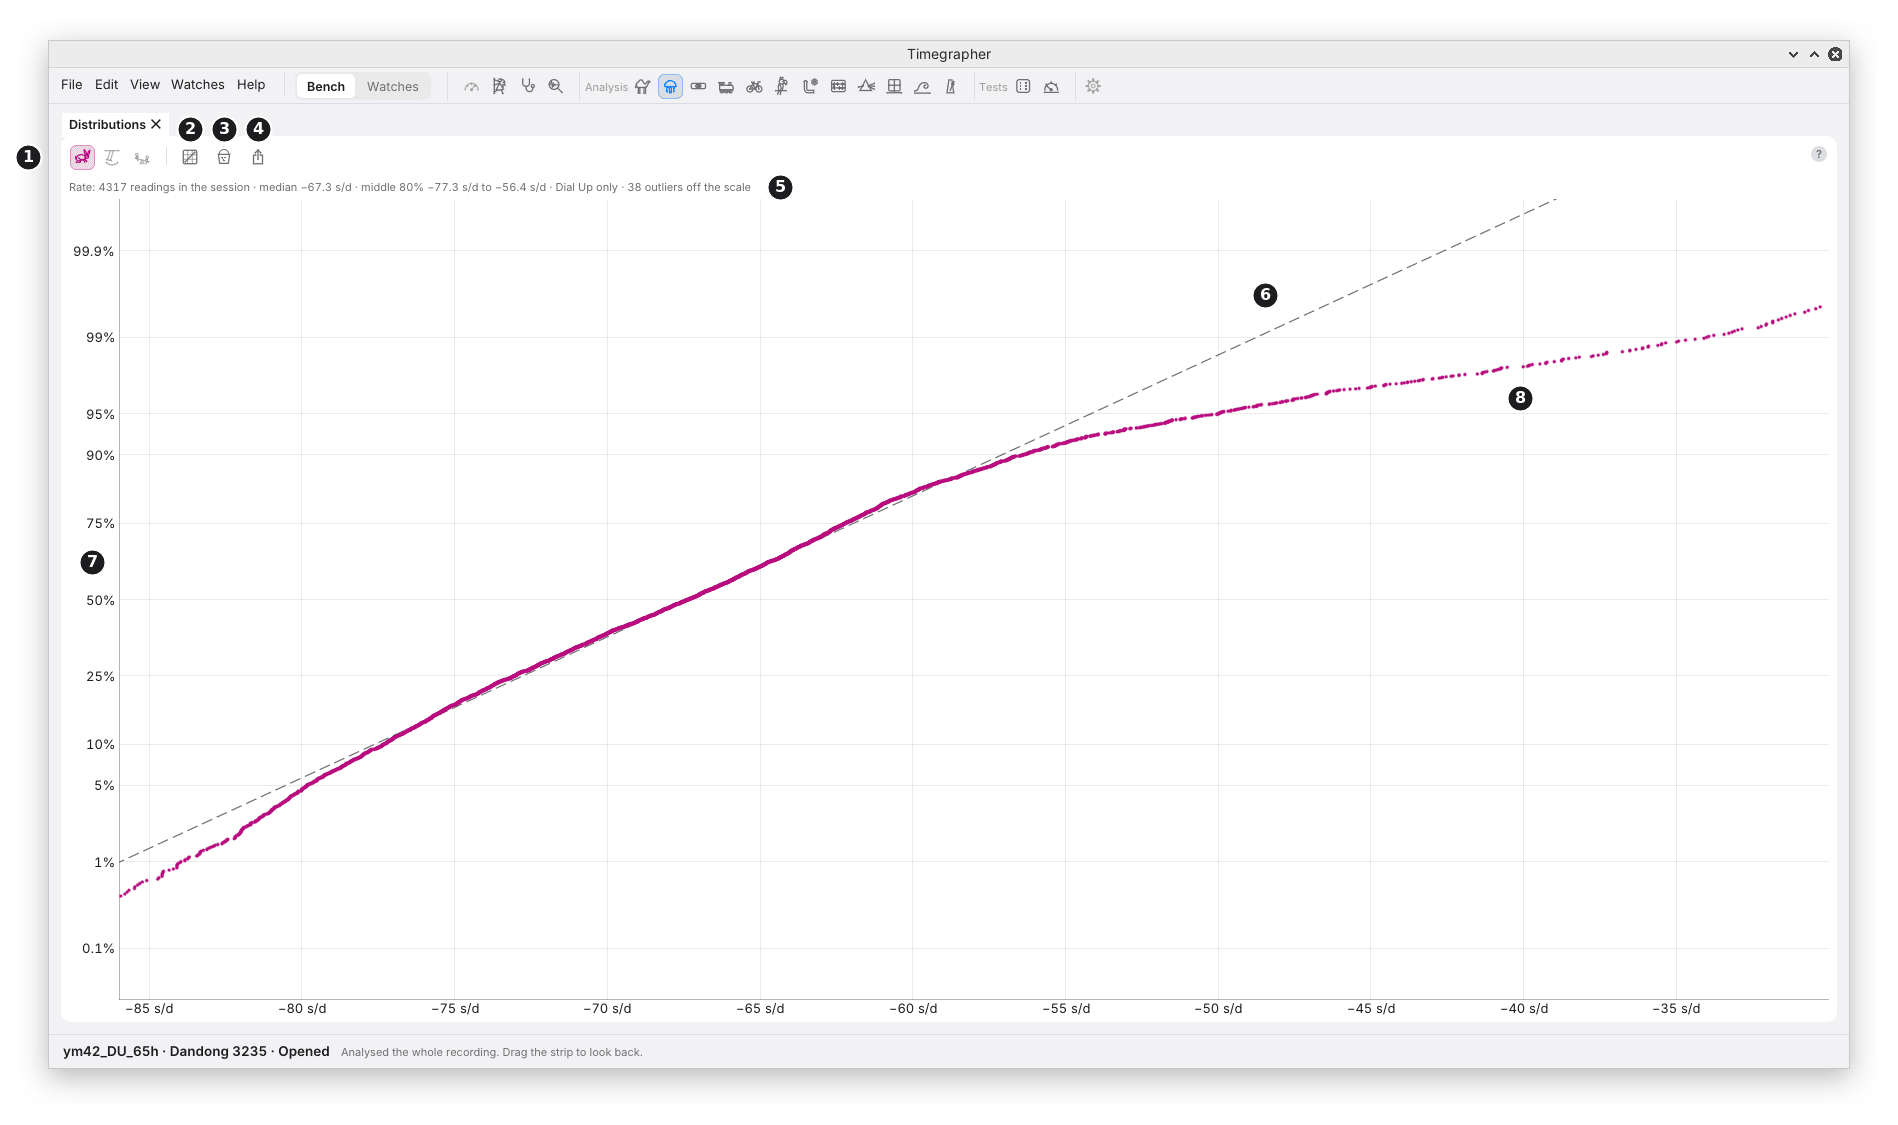
What it shows: how the values of each reading spread over the take in the position the watch is in now. A masked stretch is left out.
Why you’d use it: an average gives one number. A distribution shows whether the watch keeps to one state or moves between two, such as a high and a low amplitude, or a rate that jumps between two values.
The Toolbar
| Mark | Control | What it does | Why you’d use it |
|---|---|---|---|
| 1 | Rate, Amplitude, Beat Error (the hare, the swing and the seesaw) | Show or hide each reading’s plot. At least one stays on. | Fewer plots give each more height. |
| 2 | Show | Probability (the default): probability paper. Cumulative: the share of values at or below each value. | Probability makes one steady state a straight line, so two states stand out. Cumulative reads directly as a share. |
| 3 | Values | Readings (the default): one value per Average Over, so no two share beats. 2 s: one value per 2 s of beats; for the rate, the rate over each 2 s of beats. | Readings shows states that last longer than Average Over. 2 s catches quicker changes, with much more scatter: a 2 s rate scatters far more than a 10 s one. |
| 4 | Export… | Saves the pane as a picture, PNG or SVG. |
The Plot
| Mark | Part | What it shows |
|---|---|---|
| 5 | The summary line | How many values, the median, the middle 80%, the one position counted, the outliers left off the scale, and the peaks when there is more than one. |
| 6 | The dashed line | Where the values would fall if they came from one steady state. It goes through the median, with a slope from the middle half of the values. |
| 7 | The percent scale | Each value’s rank, spaced in standard deviations and labelled in percent. 50% is the median. |
| 8 | A value | One reading. In the picture, the fastest readings bend away to the right of the line. |
Hover the summary line to read it whole when the pane is narrow.
In the picture are the first 12 hours of the run in the Charts picture: 4317 rate readings, median −67.3 s/d, the middle 80% from −77.3 to −56.4 s/d. From the bottom to about the 85% line the points lie along the dashed line: one steady rate with random scatter. Above it they bend away to the right: a tail of fast readings that one steady state doesn’t give. Readings Over Time (chapter 10) shows where much of it comes from: the first 47 minutes after winding, at about −46 s/d, before the rate settled near −68 s/d. A plain average would mix the two and hide that the watch has a second, faster state.
Reading Probability Paper
On probability paper, each value is drawn against its rank, on a scale spaced so that values from one steady state with random scatter fall on a straight line. That makes departures from one state easy to see:
| The points | What it can mean |
|---|---|
| Along the dashed line | One steady state, with random scatter. |
| Two straight stretches joined by a bend | Two states: the watch spent part of the take at one level and part at another. |
| Flat through the middle, steep at both ends | Two states close together. |
| Both ends bending away from the line | One state with more large departures than random scatter gives, such as occasional disturbances or a slow wander. The Charts show which. |
| A few points off at one end | A few readings unlike the rest. The Charts show when they came. |
Probability paper keeps no time order. It shows that there were two states, not when. The Charts and the strip show when.
Good to Know
- One position at a time. Values from another position are a different measurement, so the plot counts only the position the watch is in now, and, when the take has positions marked, the summary line names it (“Dial Up only”).
- The scale leaves out the outermost 0.5% at each end, so a stray value can’t squeeze the rest together. The summary line counts them.
- The beat error plot says above it which measurement it uses (from the unlock or from the drop). When values from the other one were left out, it says how many were used, counted in the 2 s windows the values are made from, whichever Values is set to.
- 2 s values are the finest the app measures. None reaches across a cut or into a masked stretch.
Previous: The Tick Tock Profile and the Scope · Next: Steadiness
This page comes from the app's user guide at v1.0.1. See it on GitHub.