9. Steadiness: What It Is For, the Toolbar and Info
The readings cards give one number for each reading. The Charts show it over time. Steadiness asks how it behaves over time: whether the rate, the amplitude or the beat error holds one level, steps to another, drifts, wanders, or repeats on a cycle. It runs a set of statistical tests on the readings and shows what each one found.
It states what it finds, with the figures behind it. It doesn’t say whether that is good or bad for a watch: that is yours to judge.
The Views
Steadiness has nine views. Each is a pane of its own, so two can sit side by side. Their icons sit together under Analysis in the icon bar, and in View > Analysis. They start hidden, as tabs beside the Tick Tock Profile.
| View | Shows | Chapter |
|---|---|---|
| Readings Over Time | Every reading in time order, with the stretches of constant level. | 10 |
| Periods | How strongly the readings repeat at each period. | 11 |
| Cycle | The readings folded at the cycle found, one cycle laid over the next. | 12 |
| Autocorrelation | How much each reading resembles the one a lag later. | 13 |
| Allan Deviation | How the scatter of an average changes as it gets longer. | 14 |
| CUSUM (cumulative sum) | The running sum of each reading’s distance from the mean: steps in level. | 15 |
| FFT (Fast Fourier Transform) | The size of each period in the readings, like the FFT view on a Witschi timegrapher. | 16 |
| STFT Map (Short-Time Fourier Transform) | Each period’s size over the take, read over 20 min windows. | 17 |
| Wavelet Map | Each period over the take, sharply placed in time, from short wave-shaped pulses (wavelets) matched to each period. | 18 |
The Toolbar and Info
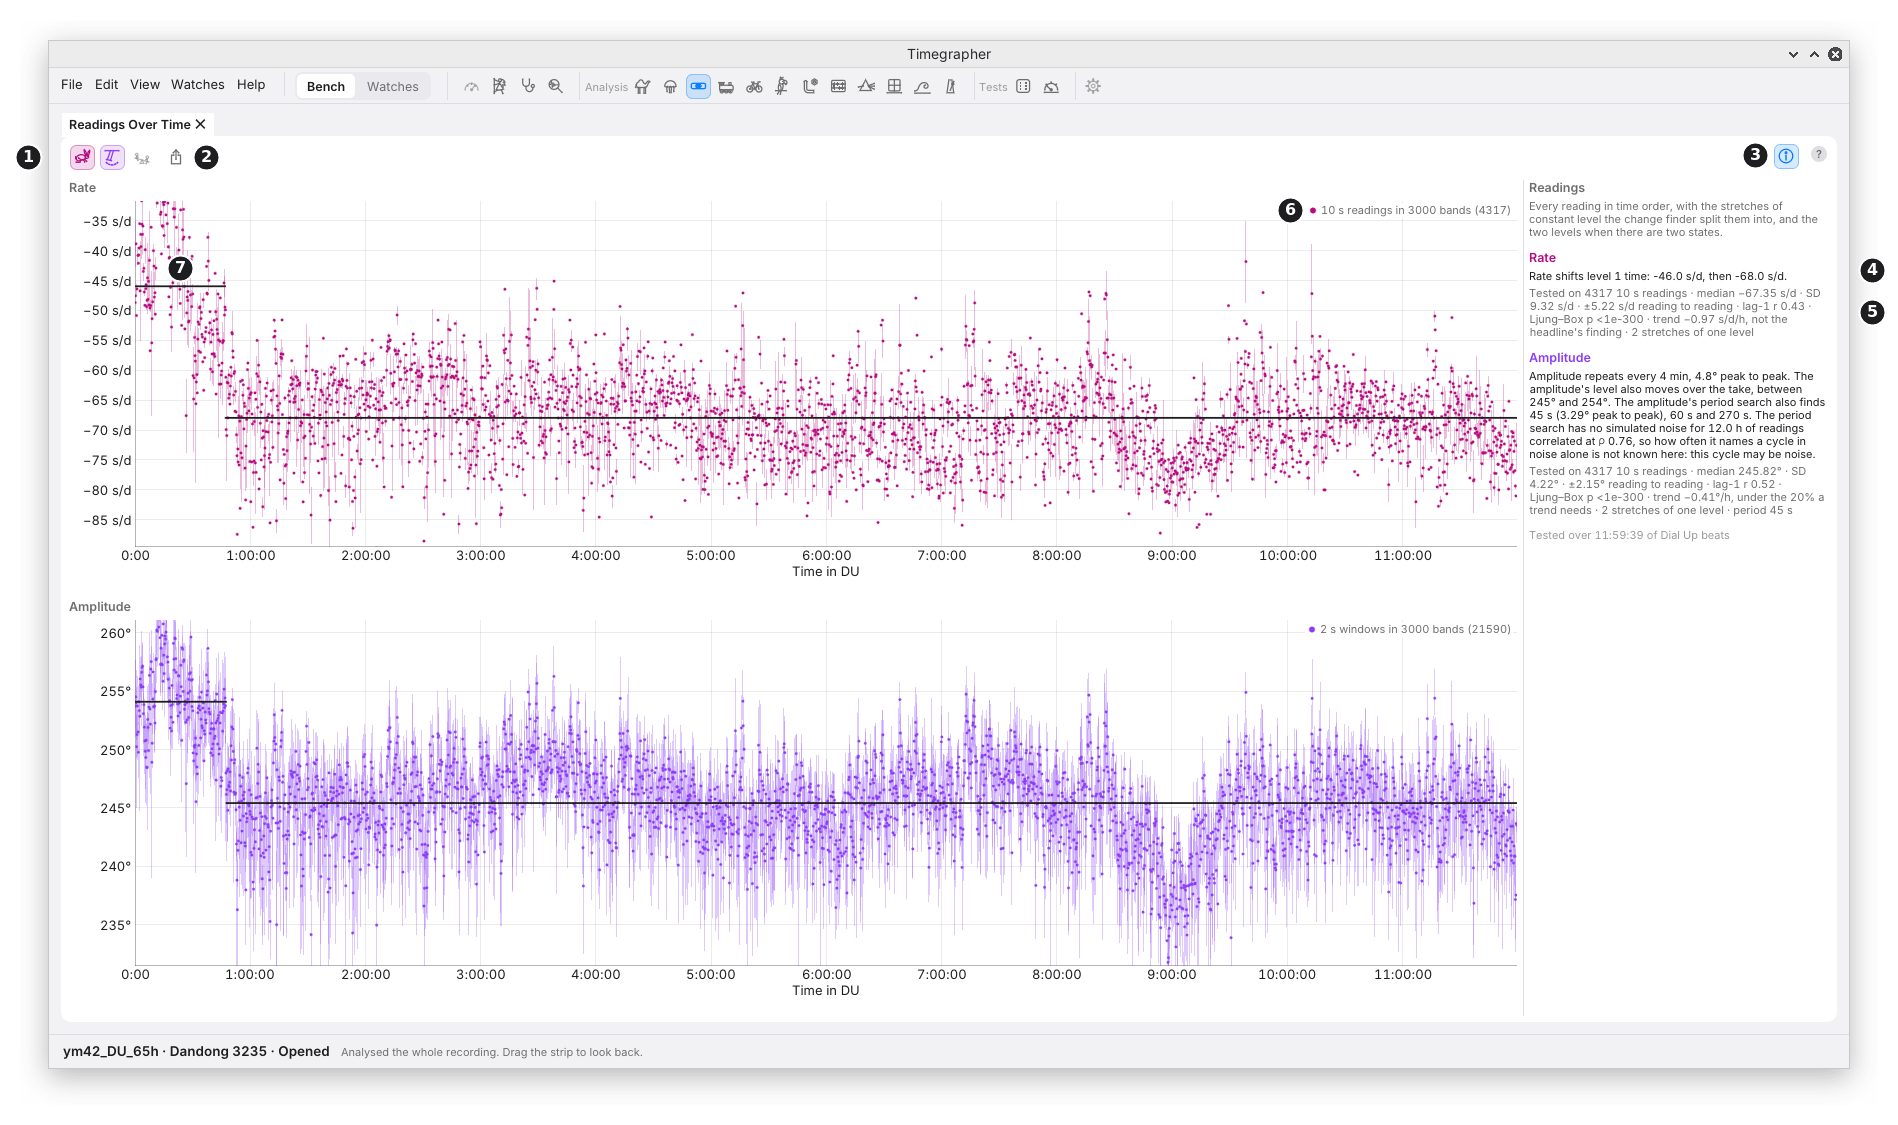
| Mark | Control or part | What it does | Why you’d use it |
|---|---|---|---|
| 1 | Rate, Amplitude, Beat Error (the hare, the swing and the seesaw) | Show or hide each series in this pane. Rate alone at first; at least one stays on. | To compare the three, or give one the room. Each pane keeps its own choice, except the STFT and Wavelet Maps, which share one and show one series at a time. |
| 2 | Export… | Saves the pane as a picture, PNG or SVG. | |
| 3 | Info | Opens the Info panel down the right of this pane, or over its plots from the top right when the pane is under 600 pt wide. It opens and closes only when clicked; each pane keeps its own, between runs too. | To read what the tests found, in words and figures. |
| 4 | A series’ sentence | What was detected in that series, in one or two sentences: a cycle, two levels, a level change, a trend, correlation between readings, or none of these. | The headline: start here. |
| 5 | The statistics | What was tested (“Tested on 4317 10 s readings”), the median, the standard deviation, the scatter from one reading to the next, the lag-1 correlation, the Ljung–Box p-value, the trend whenever one was fitted (and why it isn’t named, when it isn’t), the period when found, the number of stretches of one level, and any readings left out as more than 6 σ from their 5-minute level. | The figures behind the sentence. |
| 6 | The key | What a dot is, and how many are drawn. | To know what is plotted: 10 s readings for the rate, 2 s windows for the amplitude and beat error. |
| 7 | A stretch | A level the change finder found (chapter 15). | To see where the level changed. |
In the picture are the first 12 hours of the Dandong 3235 run-down from chapter 8, the rate and the amplitude shown. The Info panel puts into words what the plots show: “Rate shifts level 1 time: -46.0 s/d, then -68.0 s/d.” The change came 47 minutes after winding, and the amplitude stepped down at the same moment, from about 254° to 245°. Both then dip together near 9 hours. The statistics under each sentence say how far to trust it: the rate readings follow each other (lag-1 r 0.43), so a plain ± over them would be too small (M7), and the amplitude’s 4-minute cycle is named with the caution that it may be noise.
Some views add their own switches to the toolbar: dB Scale (Periods and the two maps), Timing (FFT) and Wheel Periods (Periods, FFT and the two maps). Their chapters cover them.
The words in the Info panel can be selected and copied.
What the Tests Read
- The whole take, in the position on show. Steadiness reads the position the watch is in now. When the take has several stretches in that position, they are joined end to end, and each join is a cut (M6).
- Settled and unmasked. Settling time and masked stretches are left out, as for the readings.
- 5 minutes at least. The tests need 5 minutes of beats. While listening, they run again each time another minute has come in; an opened take is read once, in the background.
- The same reading length for all three. The rate is read in 10 s readings. The amplitude and the beat error are measured in 2 s windows; the windows inside each rate reading make one reading, their median. Cycles in the amplitude and the beat error are looked for in the 2 s windows, so the Cycle and Autocorrelation views can show one as short as 6 s; the period search starts at 16 s (chapter 11).
- No reading over part of its span. A reading short of a window, or touching a cut or a mask, is left out, not averaged over what is left.
- The beat error is the one from the unlock where the unlock is found, otherwise from the drop. Where its sign turns over across a cut, its readings are drawn as sizes.
How Sure the Tests Are
Every test that gives a p-value (the period search, the Ljung–Box test, the trend and the CUSUM) is held to one standard across all three series, so running many tests on one take doesn’t add up to a false alarm.
- A finding is named only when its own test passes, and also passes Holm’s correction at 0.05 across the whole family of tests.
- On a steady watch, the tests aim to name nothing on 95 takes in 100. On the project’s seeded 2-hour steady takes they name nothing on 192 in 200. On 30 minute takes with independent readings, they name something on up to 20 in 300.
- Correlated readings (each reading like the last, M7) raise the chance of a finding on short takes. On a 30 minute take whose readings follow each other closely (ρ 0.9), the tests named something on up to 20 takes in 100; on a 2-hour take, on up to 7 in 100.
The thresholds are for detection: how sure a finding must be before it is named. None of them is a tolerance for a watch.
When You’d Use It
- A rate that won’t settle: to tell drift, wander, a step and a cycle apart.
- A periodic fault: a cycle at a wheel’s period points at that wheel (chapters 11 and 12).
- After service or adjustment: to see whether the readings now hold one level.
- Long takes: over hours, a slow change in amplitude or rate shows as a trend.
What It Can’t Tell You
- The cause. A cycle at the escape wheel’s period says the readings repeat at that period; it doesn’t say what is wrong with the wheel.
- Anything faster than its readings. 10 s readings can’t show a change faster than 20 s. The rate’s faster cycles come from the beat timing instead (chapter 11).
- Anything in a short take. 5 minutes is the least the tests run on. A cycle needs several turns inside the take to be found.
Previous: Charts and Distributions · Next: Readings Over Time
This page comes from the app's user guide at v1.0.1. See it on GitHub.