13. Autocorrelation
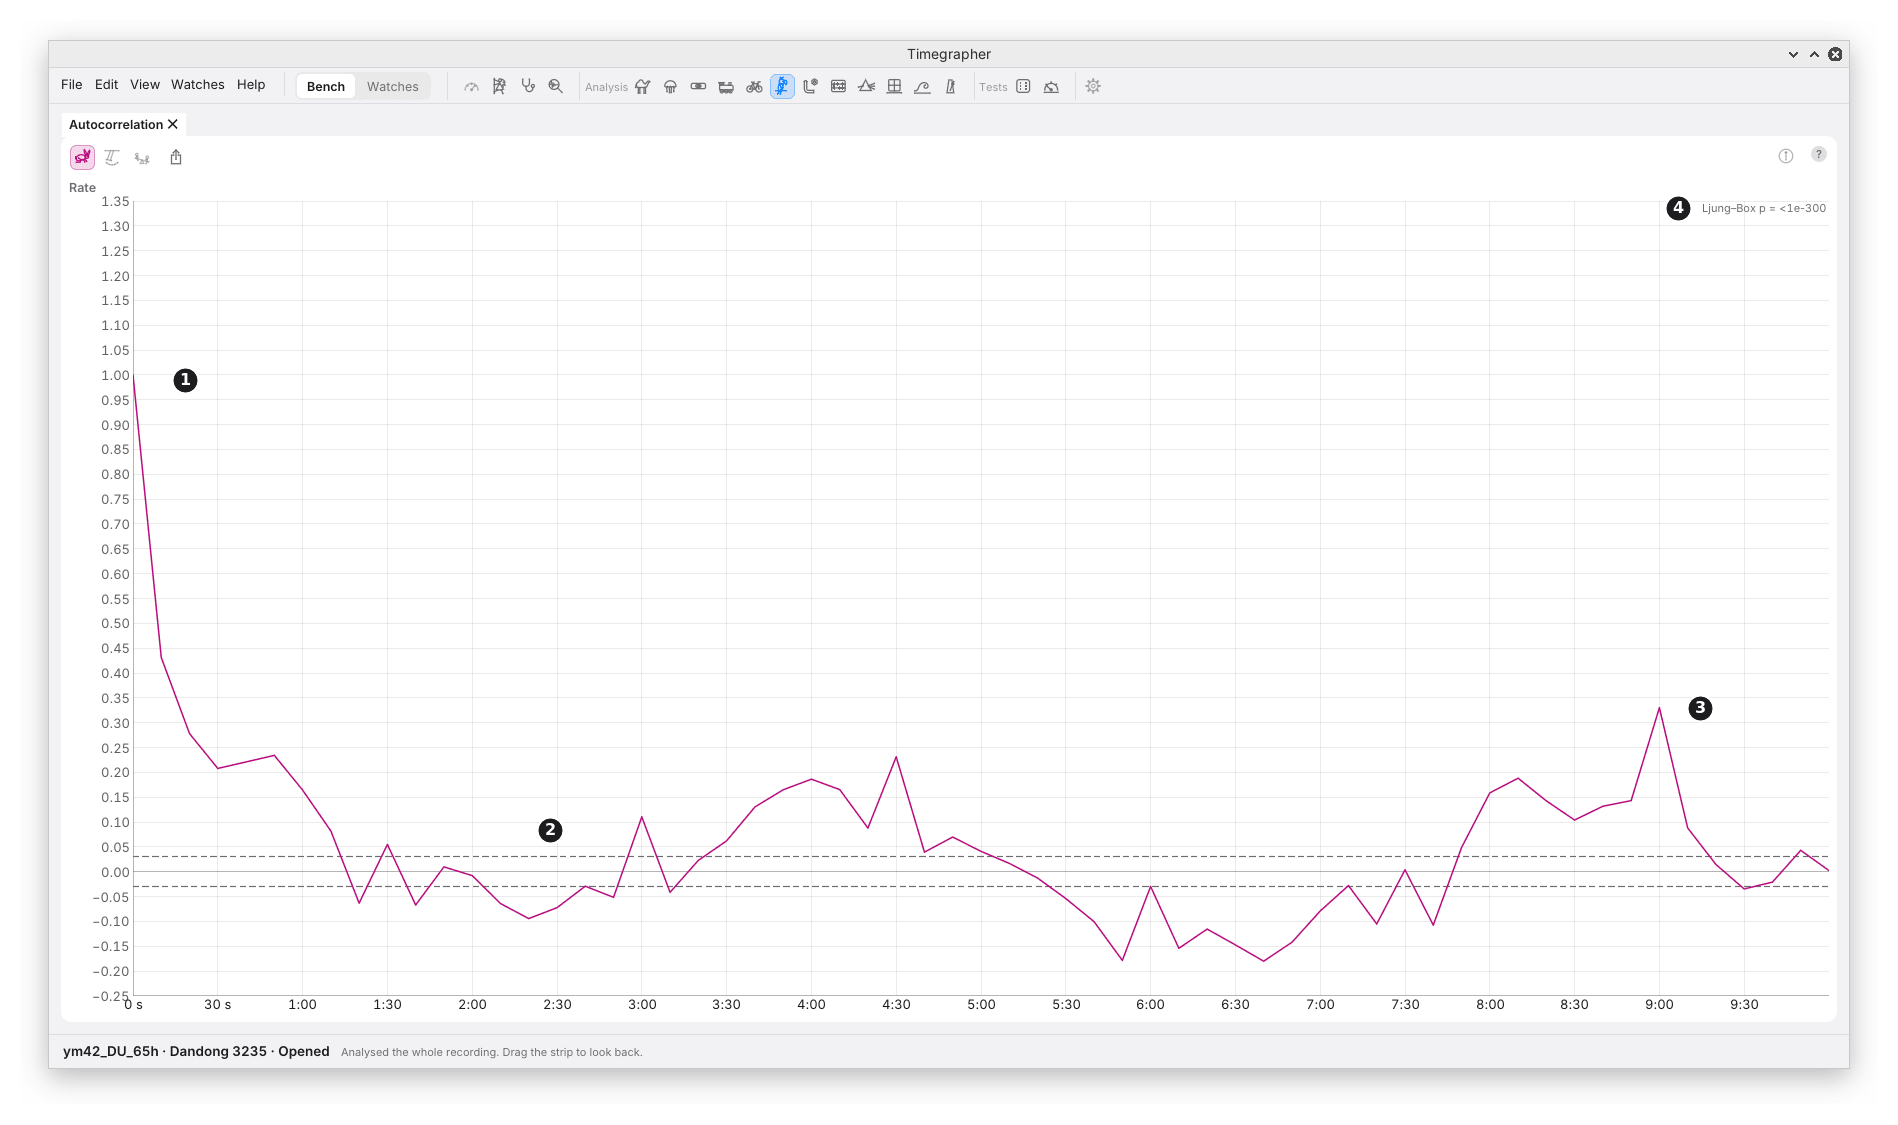
What it shows: how much each reading resembles the one a given time later, the lag, from 0 up to 10 minutes, or a third of the take if that is shorter. 1 is the same, 0 is no resemblance, below 0 is opposite.
Why you’d use it: to know whether the readings are independent, each one a fresh draw, or whether each follows the last. It also finds a repeat that the period search may score too low to list.
| Mark | Part | What it shows |
|---|---|---|
| 1 | Lag 0 | Every reading matches itself: always 1. |
| 2 | The band | The dashed lines at ±1.96/√n, n the number of readings, flat across every lag. Independent readings stay inside it at about 19 lags in 20; where gaps leave fewer pairs at a lag, they scatter a little wider. |
| 3 | A lag outside the band | A resemblance at that lag. One in twenty lags lands outside by chance. |
| 4 | The Ljung–Box p-value | One test over the first 10 lags together: the chance of resemblance this strong if the readings were independent. |
When the line falls and then rises back to a peak, the readings repeat: the peak gets a dot and a note, “repeats at 60 s”.
How It Is Worked Out
- Slow change taken off first, with the same 30-minute running median as the period search (a quadratic for takes under 20 minutes), so a rate drifting as the mainspring runs down isn’t counted as resemblance.
- Corrected for that, since taking the slow change off leaves a small negative resemblance of its own. Independent readings then read about 0 at every lag.
- Gaps are left as gaps. Each lag is read from the pairs of readings that lag apart. A lag with under 30 pairs is still drawn, but counts for nothing in the Ljung–Box test or the search for a repeat.
- The Ljung–Box test weighs each of the first 10 lags by the pairs it is read from, and is judged against what independent readings of the same count, with the slow change taken off the same way, give.
- How long the resemblance lasts is the lag where it falls below 1/e, about 0.37. The headline gives it when it says the readings wander: “correlated for about …”. The Info panel’s figures give the lag-1 correlation and the Ljung–Box p.
What to Look For
| What you see | What it can mean |
|---|---|
| A drop to about 0 after lag 0, then inside the band | Independent readings: each one a fresh draw. |
| A slow fall over several lags | Each reading follows the last: the watch wanders. The ± allows for it (M7). As in the picture. |
| A fall and a rise to a peak | The readings repeat at the peak’s lag. |
| A Ljung–Box p under 0.05 | Resemblance across the first 10 lags, beyond chance. The headline names it only if it also passes Holm’s correction (chapter 9). |
In the picture are the first 12 hours of the Dandong 3235 run-down from chapter 8: 4317 rate readings, so the band is narrow, ±0.03. The readings are far from independent. Each 10 s reading resembles the next by 0.43, and the resemblance lasts about a minute before it first falls inside the band. After that the line swings well outside the band on both sides in a slow wave, up near 4 and 8 to 9 minutes, down near 2 and 6 minutes: the same rise and fall every few minutes that Cycle (chapter 12) folds. The Ljung–Box p is under 10⁻³⁰⁰. So a ± worked out as if each reading were a fresh draw would be far too small, which is why the app’s ± allows for it (M7). By the lag-1 resemblance alone, the 4317 readings carry about as much evidence as 1,700 independent ones.
What It Can’t Tell You
- Why the readings follow each other. Wander in the watch, a changing temperature and a slowly changing sound all give the same slow fall.
- A repeat faster than two readings. Lags step by one reading, 10 s for the rate.
Previous: Cycle · Next: Allan Deviation
This page comes from the app's user guide at v1.0.1. See it on GitHub.