16. FFT (Fast Fourier Transform)
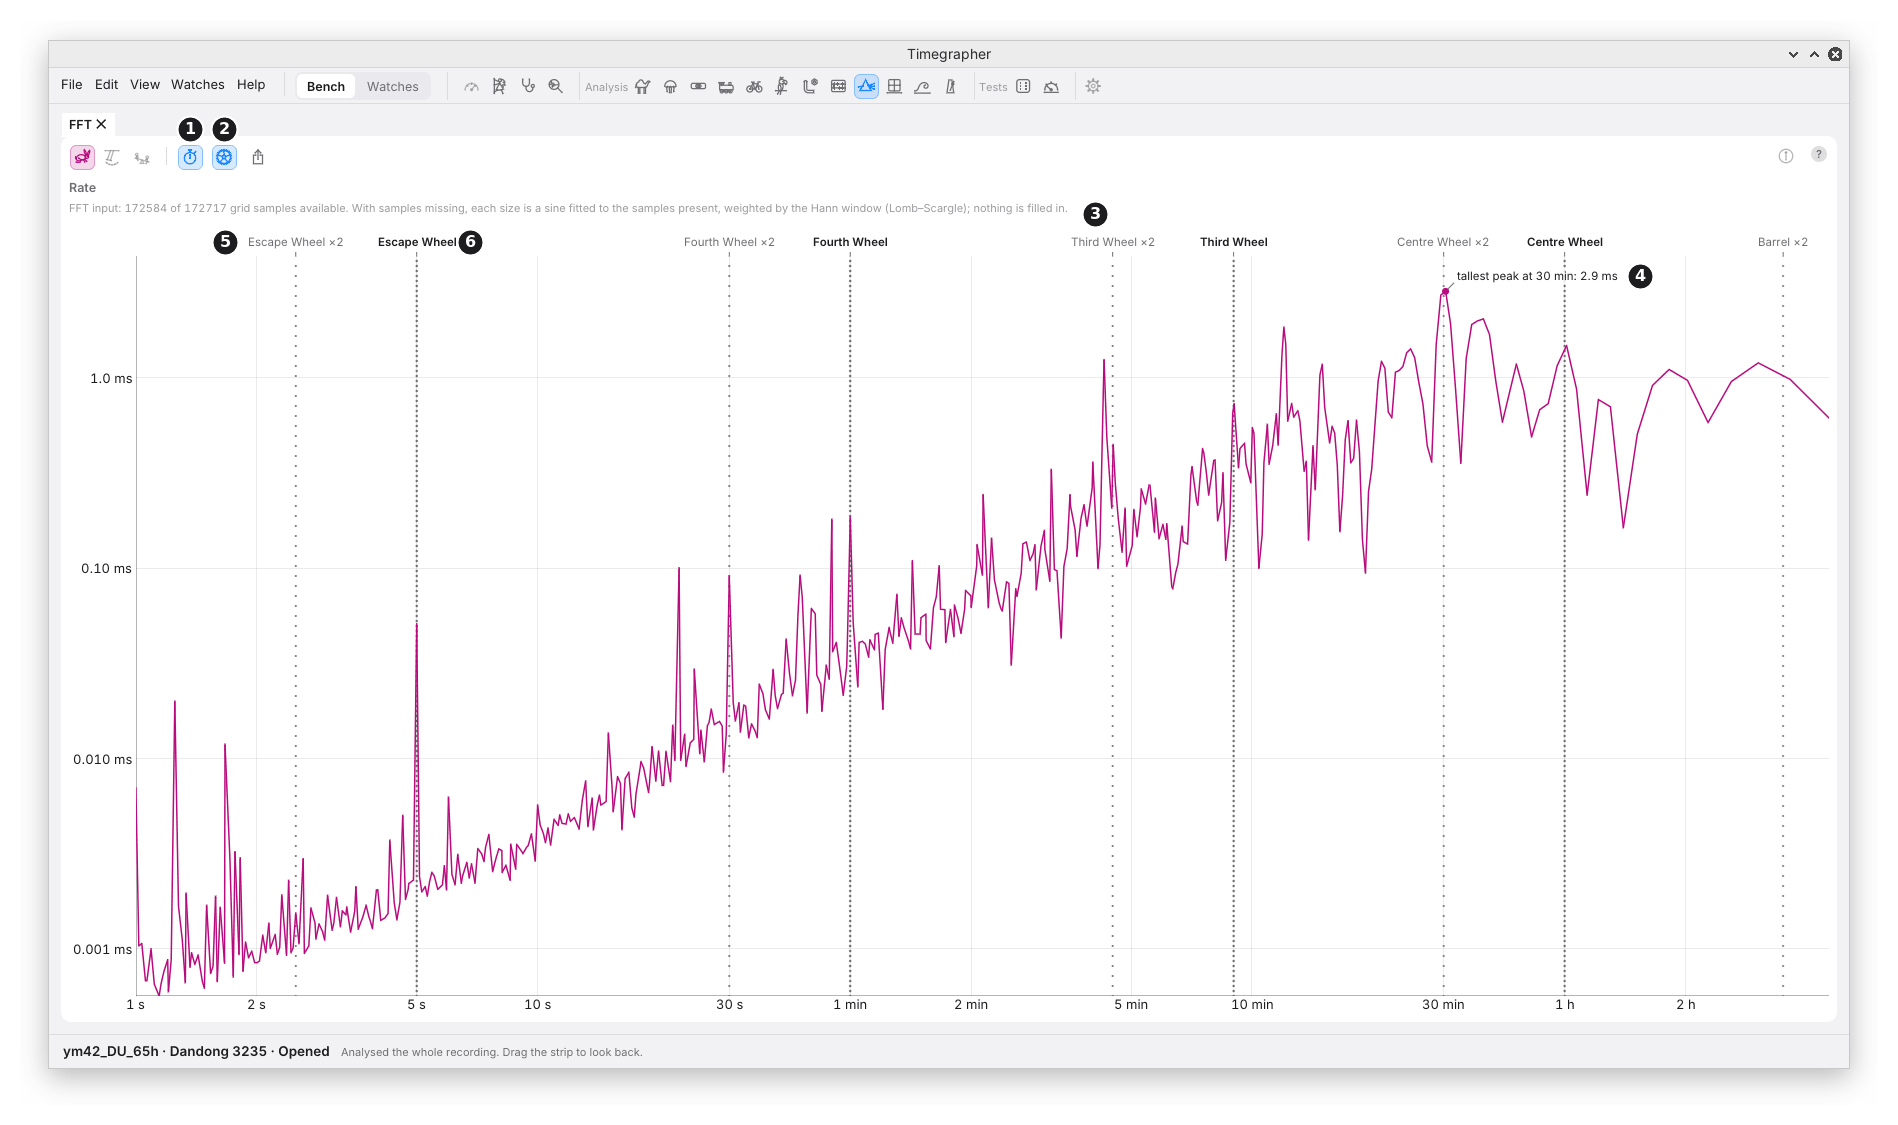
What it shows: the amplitude spectrum of each series, worked out by the Fast Fourier Transform (FFT), the standard way to split a series into the regular swings it holds: how big a regular swing the readings hold at each period, in the series’ own unit. Both axes are logarithmic. It is the view a commercial timegrapher’s FFT gives.
Why you’d use it: to see the size of every period’s swing side by side, the strong ones and the weak ones, on one axis. Periods (chapter 11) says which periods the readings repeat at, beyond doubt; the FFT says how big each one is, whether or not it passes a test. When you know what you are looking for (a wheel you have just worked on, a swing you saw on another timegrapher), this is where you read its size.
| Mark | Part | What it does or shows |
|---|---|---|
| 1 | Timing | For the rate: draws the spectrum of the beat timing itself, in ms, at every period, in place of the swing in rate readings. Off at first, and greyed while Rate is off. |
| 2 | Wheel Periods | Marks the calibre’s wheels’ periods. On at first; this pane only. With no calibre picked, or none of its wheels known, it marks one minute and one hour in grey instead. |
| 3 | The input line | How much of the series the spectrum was read from: “FFT input: 172584 of 172717 grid samples available”, and how missing samples were handled. |
| 4 | The tallest peak | The highest point above both its neighbours, with its period and size: “tallest peak at 30 min: 2.9 ms”, or for the rate readings, “tallest peak at 4 min: 5.3 s/d peak to peak”. |
| 5 | Twice a turn | A fainter dotted line marked ×2, at half a wheel’s period. |
| 6 | A wheel’s period | A bold dotted line, named above the plot. |
What the Sizes Mean
| Series | Size | Periods drawn |
|---|---|---|
| Rate | The swing peak to peak that a sine at that period makes in 10 s rate readings, in s/d. | From 20 s, twice a reading, up. |
| Rate, with Timing | The size of the sine in the beat timing, in ms: half its peak to peak. | From 1 s up. |
| Amplitude | The size of the sine, in degrees: half its peak to peak. | From 8 s up. |
| Beat Error | The size of the sine, in ms: half its peak to peak. | From 8 s up. |
Each spectrum reaches up to half the take.
Why the rate has two: a swing in the timing of the beats is a swing in the rate, but a 10 s reading averages most of a fast one away. The default shows what the rate readings themselves would show. Timing shows the swing as the beats have it, including periods far faster than a reading, such as the escape wheel’s 5 s.
In the picture are the first 12 hours of the Dandong 3235 run-down from chapter 8, with Timing on: the swing of the beat timing itself, from 1 s up. The floor rises from about 0.002 ms at a few seconds to about 1 ms at an hour: the slower the swing, the further the timing wanders, and the tallest peak, at 30 minutes, is that slow wander. Of the narrow lines that rise out of the floor at the short end, the tallest sits exactly on the escape wheel’s mark: 0.05 ms at 5 s, about twenty times its neighbours. The smaller spikes under 2 s match no wheel. It is the escape wheel, once a turn, steady enough over 12 hours to stand that clear, and far too fast for any rate reading to show. The fourth wheel’s minute stands out too, about 0.2 ms, with a line at its half minute. Periods (chapter 11) tests each line; on this take it keeps none, though it scores the 5 s line tallest. With Timing off, the same take’s rate readings give their own spectrum from 20 s up, tallest at 4 minutes, 5.3 s/d peak to peak: the cycle that Cycle (chapter 12) folds.
How It Is Worked Out
- On the series the period search reads (chapter 11): on the watch’s own clock, the rate from the beat timing, the amplitude and beat error from their 2 s windows, with the slow change taken off by the same 30-minute running median.
- A sine fitted at each period, to the samples present, each weighted by a Hann window over the whole take, less their weighted mean. With every sample present this is the ordinary windowed FFT; with some missing it is the Lomb–Scargle periodogram, so nothing is filled in and a line keeps its size as samples go missing.
- The rate’s swing in readings: a timing sine of size a ms at period P swings the rate by 2 · a · 2π/P · 86.4 s/d peak to peak, of which a 10 s reading keeps 3(sin x − x cos x)/x³, with x = π · 10/P. M11 explains both.
- The tallest peak is a point higher than both its neighbours, so a spectrum still climbing at the long end, as the rate’s slow wander makes it, labels its own peak and not the end.
What to Look For
| What you see | What it can mean |
|---|---|
| A peak at a wheel’s period | A swing once per turn of that wheel. |
| A peak at a wheel’s ×2 | Twice a turn: what an off-centre wheel can give. |
| Peaks at a half, a third, a quarter of a wheel’s period | A sharp disturbance once a turn, spread over its harmonics. |
| A spectrum rising towards long periods | Slow wander or drift. |
| A spectrum flat across | Noise with no period standing out. |
What It Can’t Tell You
- Whether a peak is real. Every spectrum has peaks; noise makes them too. Whether the readings repeat at a period is the period search’s call, with its dashed line (chapter 11).
- When. The FFT reads the whole take at once. A swing that came and went shows smaller than it was. The two maps show when (chapters 17 and 18).
- The cause. A peak at a wheel’s period says the readings swing with that wheel’s turn, not what is wrong with it.
The input line counts samples on the spectrum’s grid, not beats heard: a complete grid doesn’t mean every beat was clean.
Previous: CUSUM and Change Points · Next: STFT Map
This page comes from the app's user guide at v1.0.1. See it on GitHub.