17. STFT Map (Short-Time Fourier Transform)
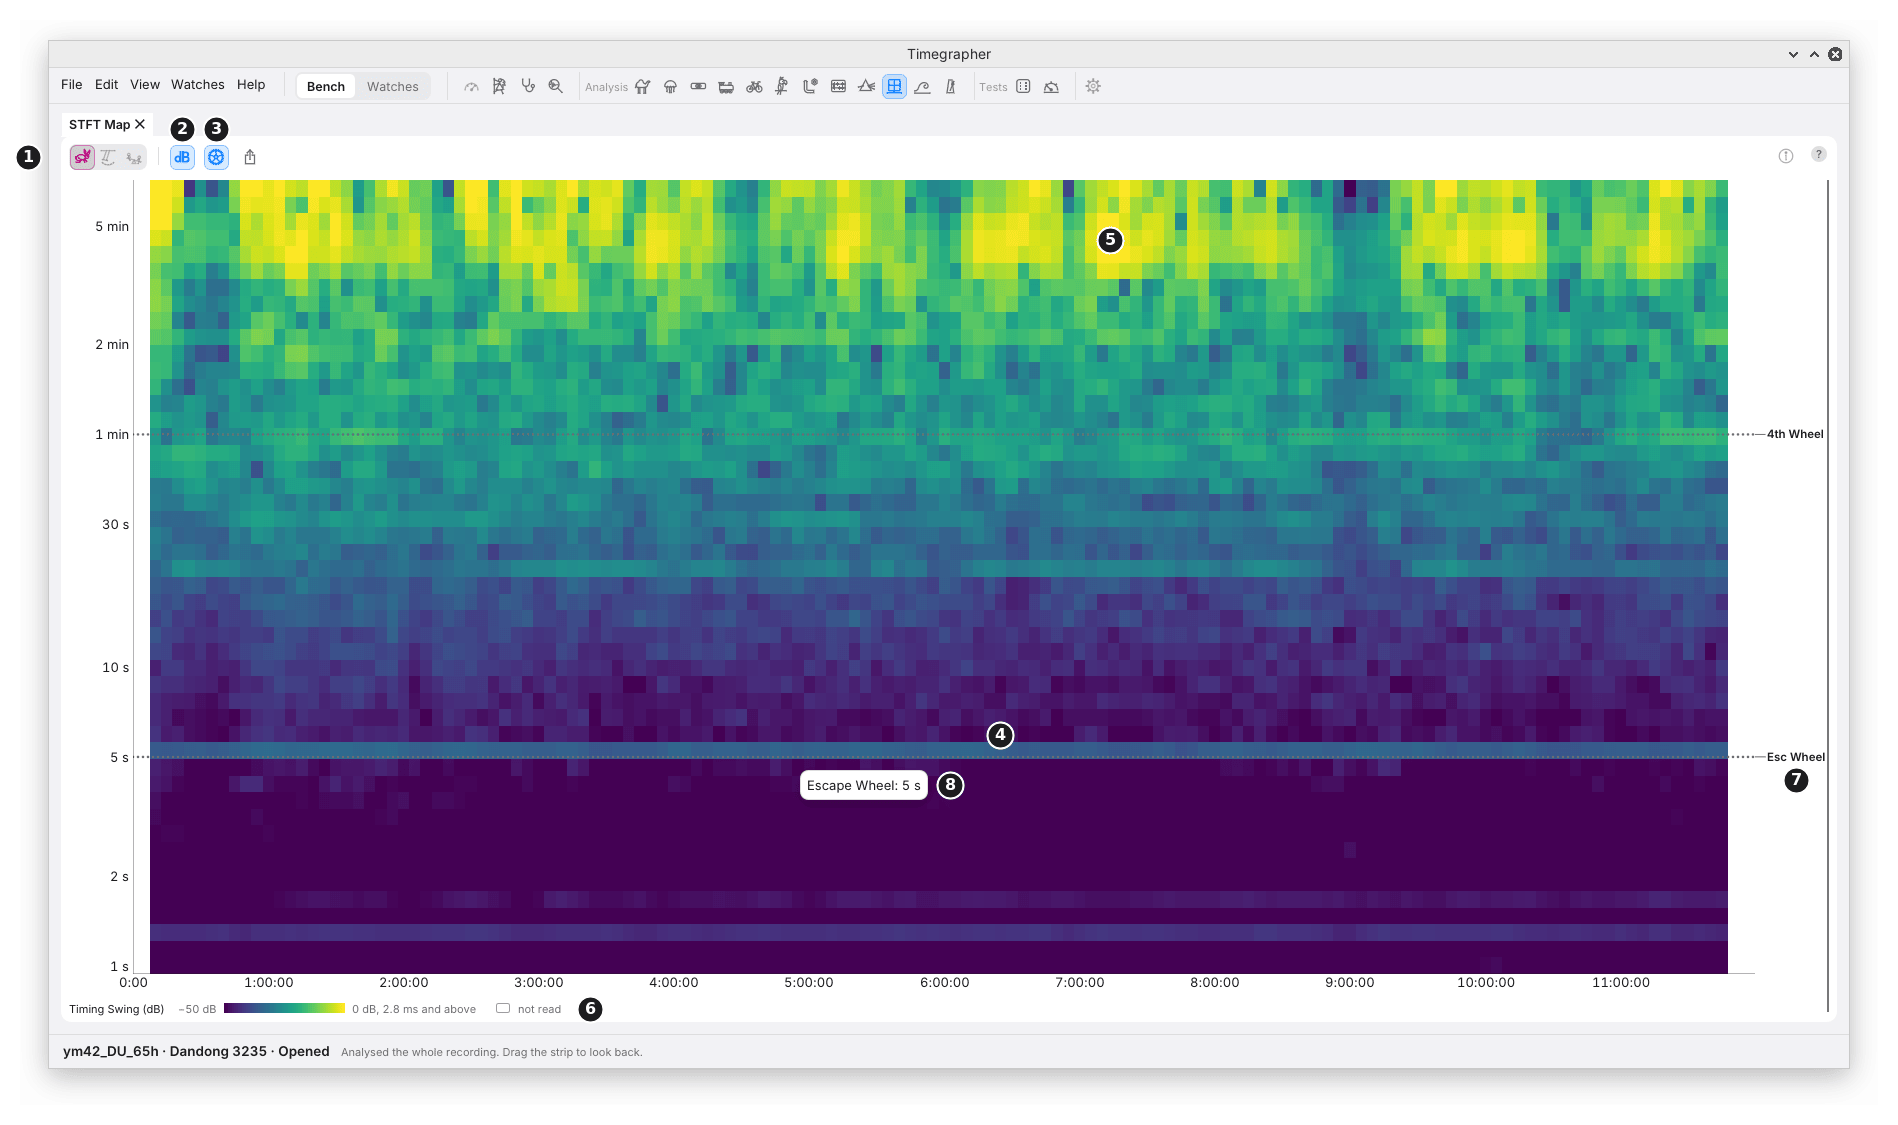
What it shows: the size of each period’s swing at each time of the take. Up the side is the period, on a log scale, the longest at the top; across is the time of the take. Each cell’s colour is the size, from dark purple for the smallest to yellow for the largest. It is made from the Short-Time Fourier Transform (STFT): the Fast Fourier Transform (FFT) of each 20 minutes of readings, stepped 5 minutes.
Why you’d use it: the FFT (chapter 16) reads the whole take at once, so a swing that came and went, or one that drifted in period, is blurred into one figure. The map shows when it was there and how big it was then. Every period is read over the same 20 minutes, so sizes compare fairly from one row to the next. Use it to see whether a wheel’s swing held through a take, grew as the mainspring ran down, or stopped after a knock.
The picture is the first 12 hours of the Dandong 3235 run-down from chapter 8, with dB Scale on.
The Toolbar
| Mark | Control | What it does | Why you’d use it |
|---|---|---|---|
| 1 | Rate, Amplitude, Beat Error | Joined into one control: the map shows one series at a time, Rate first. The Wavelet Map shares the choice. | The map needs the pane’s room. Switching between the two maps keeps the same series. |
| 2 | dB Scale | Colours the sizes in decibels below the brightest, over the map’s own range of up to 300 to 1, so the key reads from 0 dB down to about −50 dB at most. The key’s title then ends “(dB)”, and its top end gives the size 0 dB stands for. This map only. | A weak line beside a strong one still shows. |
| 3 | Wheel Periods | Marks the calibre’s wheels’ periods across the map. On at first; this pane only. | To match a line to a wheel. |
Export… and Info are as in every Steadiness view (chapter 9).
The Map
| Mark | Part | What it shows |
|---|---|---|
| 4 | A line across | A swing at one period that holds through the take. Here the escape wheel’s 5 s, in every window. |
| 5 | A bright patch | A swing that comes and goes. Here at periods of about 3 to 7 minutes: the beat timing wandering slowly, more in some hours than others. |
| 6 | The key | What the colour measures and its unit: Timing Swing (ms) for the rate’s map, Amplitude Swing (°), Beat Error Swing (ms). From 0 up to the size 99.5% of the cells read stay under, which the brightest colour shares with every size above it. With dB Scale on, as here, “Timing Swing (dB)”, from −50 dB to 0 dB, and the size 0 dB stands for: “0 dB, 2.8 ms and above”. |
| 7 | A wheel’s name | Short names in a lane right of the map, level with their lines: 4th Wheel, Esc Wheel. |
| 8 | The pointer on a wheel’s line | The wheel’s full name and period: “Escape Wheel: 5 s”. On a cell, the pointer gives the cell’s size with its unit, its period and its time: “Timing Swing 0.003 ms · period 4 s · at 20:00”. |
An empty area is not read. Each column is one 20-minute window, drawn 5 minutes wide at its middle; a window with any reading missing is left empty, so a gap empties every window that holds it. The take in the picture has none.
In the picture, the escape wheel’s line at 5 s runs unbroken from the first window to the last: a swing of the beat timing once every turn of the escape wheel, steady through 12 hours. On the plain scale it can’t be seen at all: the slow wander at periods of minutes is many times bigger, and takes every bright colour. The dB scale gives each size its own step, so the small, steady line shows beside the large, restless top of the map. A fainter band near 20 s also runs right across. Periods (chapter 11) scores the 5 s line tallest over the take as a whole, though too small a share to name; the map adds that it held hour after hour, rather than coming from one stretch of the take.
The rate’s map is of the beat timing, in ms, not of the rate in s/d: a swing of the timing at 5 s is far too fast for any rate reading to show (chapter 16).
How It Is Worked Out
- Windows of 20 minutes, stepped 5 minutes, each with every reading present. A window holding a gap, a cut or a mask is left out; nothing is filled in.
- In each window, the straight line through the readings is taken off and a Hann window applied, then the spectrum is read.
- 48 periods, evenly spaced on the log scale, from 4 readings (1 s for the rate’s timing, 8 s for the amplitude and beat error) up to a third of the window, 400 s. Each row reads the strongest frequency in its band, halfway to the rows either side, so a line between two rows still reads within 20% of its size.
- Sizes are the sine’s size at that period, half its peak to peak, as in the FFT.
M11 explains the method and its trade-offs.
What to Look For
| What you see | What it can mean |
|---|---|
| A line across at a wheel’s period | That wheel’s swing, steady through the take. |
| A line that fades or brightens | A swing that weakens or grows: with the mainspring, the temperature or a change in the watch. |
| A line that starts or stops | Something that began or ended: a knock, a change of position, a part settling. |
| A line that slopes | A period that changes. A wheel’s period is fixed on the watch’s own clock, so a sloping line is from something that doesn’t turn with the beat, such as the room or the stand. |
| Bright cells at the longest periods | Slow wander in the series. |
What It Can’t Tell You
- Anything in a short take. It needs 20 minutes of readings with none missing, and a pane with less says so.
- Exactly when. Each column is 20 minutes of readings; a change shows over that span, not at its moment. The Wavelet Map (chapter 18) places short periods more sharply.
- Periods over 400 s. A slower wheel’s turn is beyond a third of the window: it is in the FFT and the Wavelet Map.
- Whether a line is real. That is the period search’s call (chapter 11).
Previous: FFT · Next: Wavelet Map
This page comes from the app's user guide at v1.0.1. See it on GitHub.