19. Isochronism
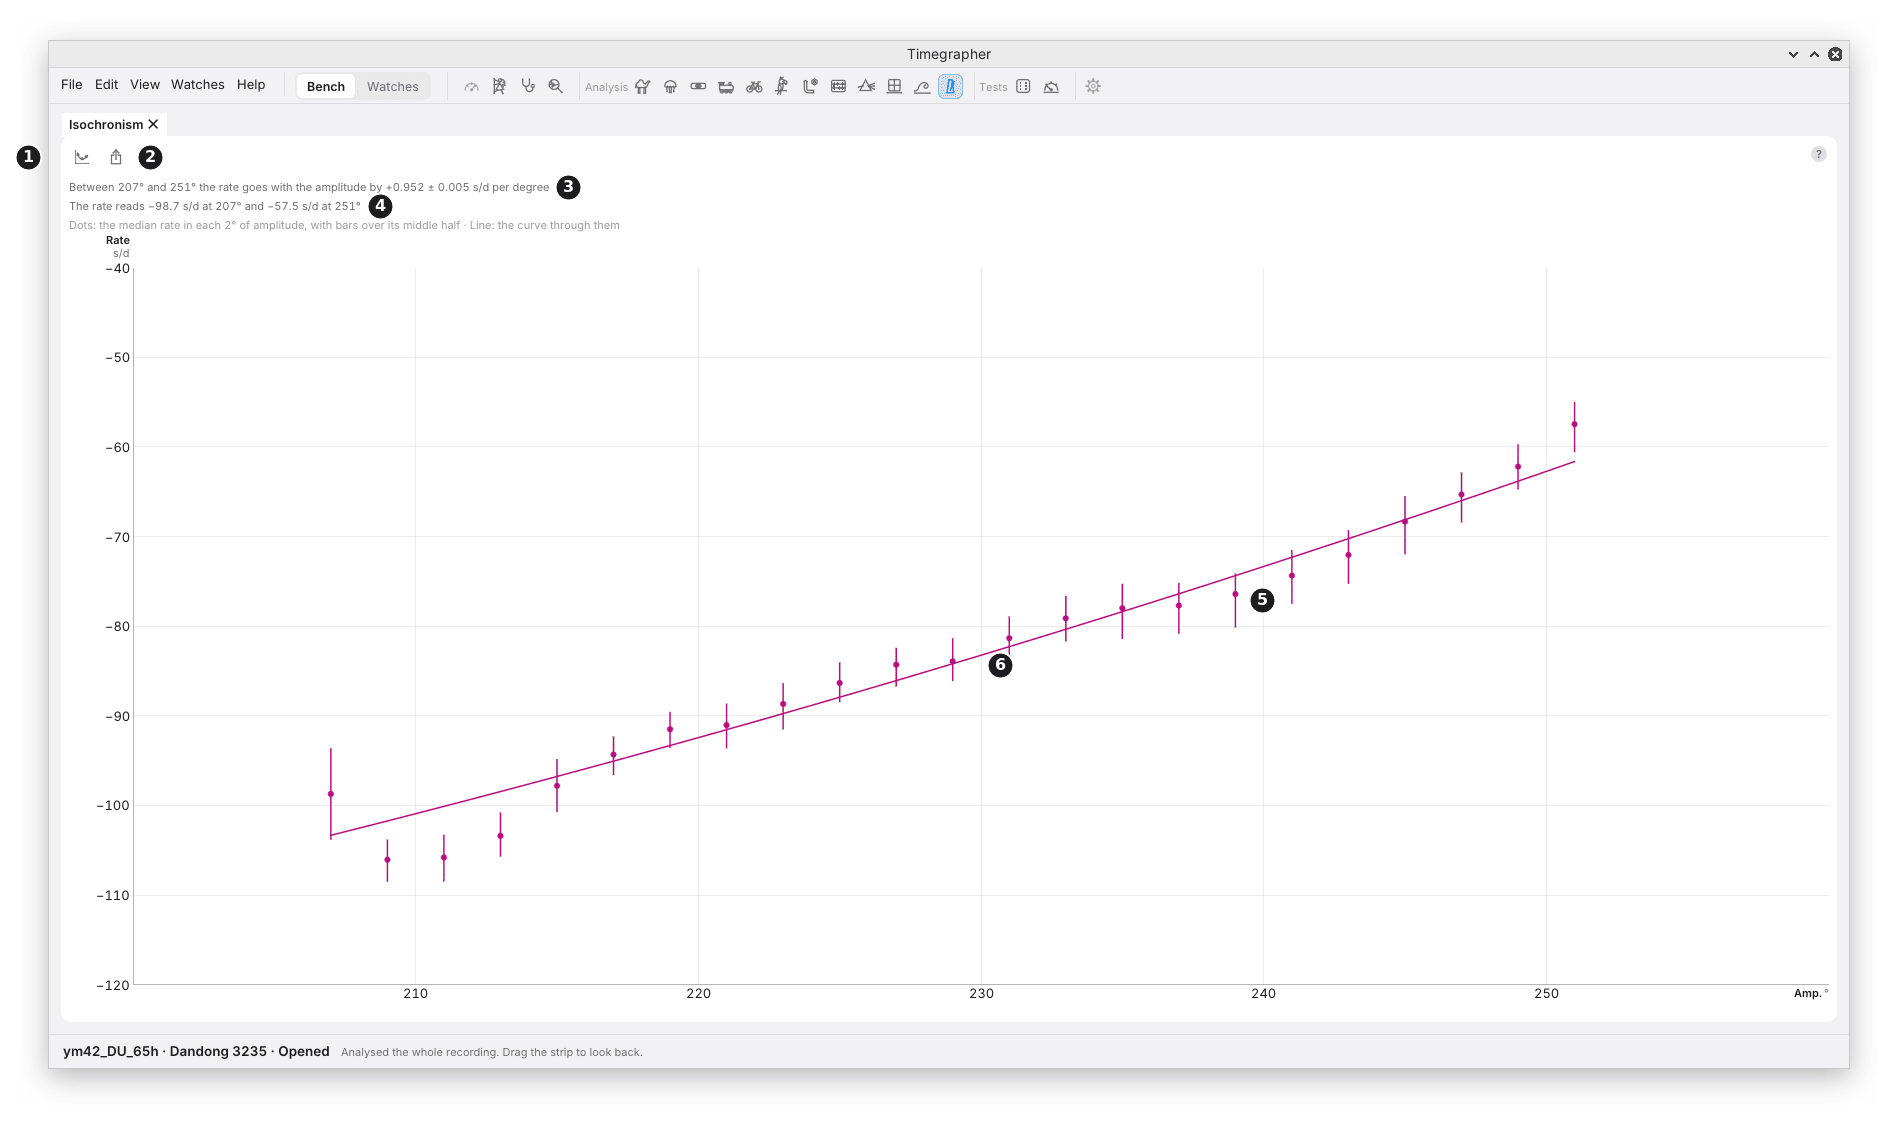
What it shows: the rate at each amplitude. As the mainspring lets down, the balance swings less, and a watch’s rate moves with it. The pane sorts the take’s 10 s rate readings by the amplitude of the same reading, 2° at a time, and shows the rate in each step and the curve through them.
Why you’d use it: a balance that kept the same rate at every amplitude would be isochronous. None is quite, and how far the rate moves as the amplitude falls is what decides how the watch keeps time through a day’s wind. Use it on a run-down, or on any take that covers a wide range of amplitude, to see how much the rate moves per degree and at which amplitude it changes least. After an adjustment to the hairspring, the balance or the escapement, compare it with a take from before.
The picture is the first 44 hours of a Dandong 3235, fully wound and left dial up until it stopped 59.8 hours later: the part of the run in which the amplitude fell smoothly, from 251° to 207°. The Walk view below shows the whole run, and why the Curve stops there.
| Mark | Part | What it does or shows |
|---|---|---|
| 1 | View | Curve (this view) or Walk (below). Kept between runs. |
| 2 | Export… | Saves the pane as a picture, PNG or SVG. |
| 3 | The slope | “Between 207° and 251° the rate goes with the amplitude by +0.952 ± 0.005 s/d per degree”: a straight line through every reading. |
| 4 | The ends | The median rate in the lowest and the highest 2° step. |
| 5 | A dot and its bar | The median rate in one 2° step of amplitude, and a bar over the middle half of its readings. |
| 6 | The curve | A quadratic through the dots, each weighted by its readings. |
Where it changes least: when the curve turns inside the range, a third line gives the amplitude where it turns (“It changes least near 213°”), and a vertical line marks it. In the picture the curve doesn’t turn, so neither is shown.
In the picture, the dots climb in a near-straight line from −98.7 s/d at 207° to −57.5 s/d at 251°, and the curve runs through nearly every bar: the slope is +0.952 ± 0.005 s/d per degree. This watch loses about 1 s/d more for each degree of amplitude it loses, so over these 44 hours of the wind its rate moved by 40 s/d. That is its isochronism, the figure an adjustment of the hairspring or the escapement would aim to flatten, and a take from after the adjustment, read the same way, shows how far it moved. The three lowest steps sit a few s/d under the line just above 207°: the start of what the Walk view shows next.
The Walk View
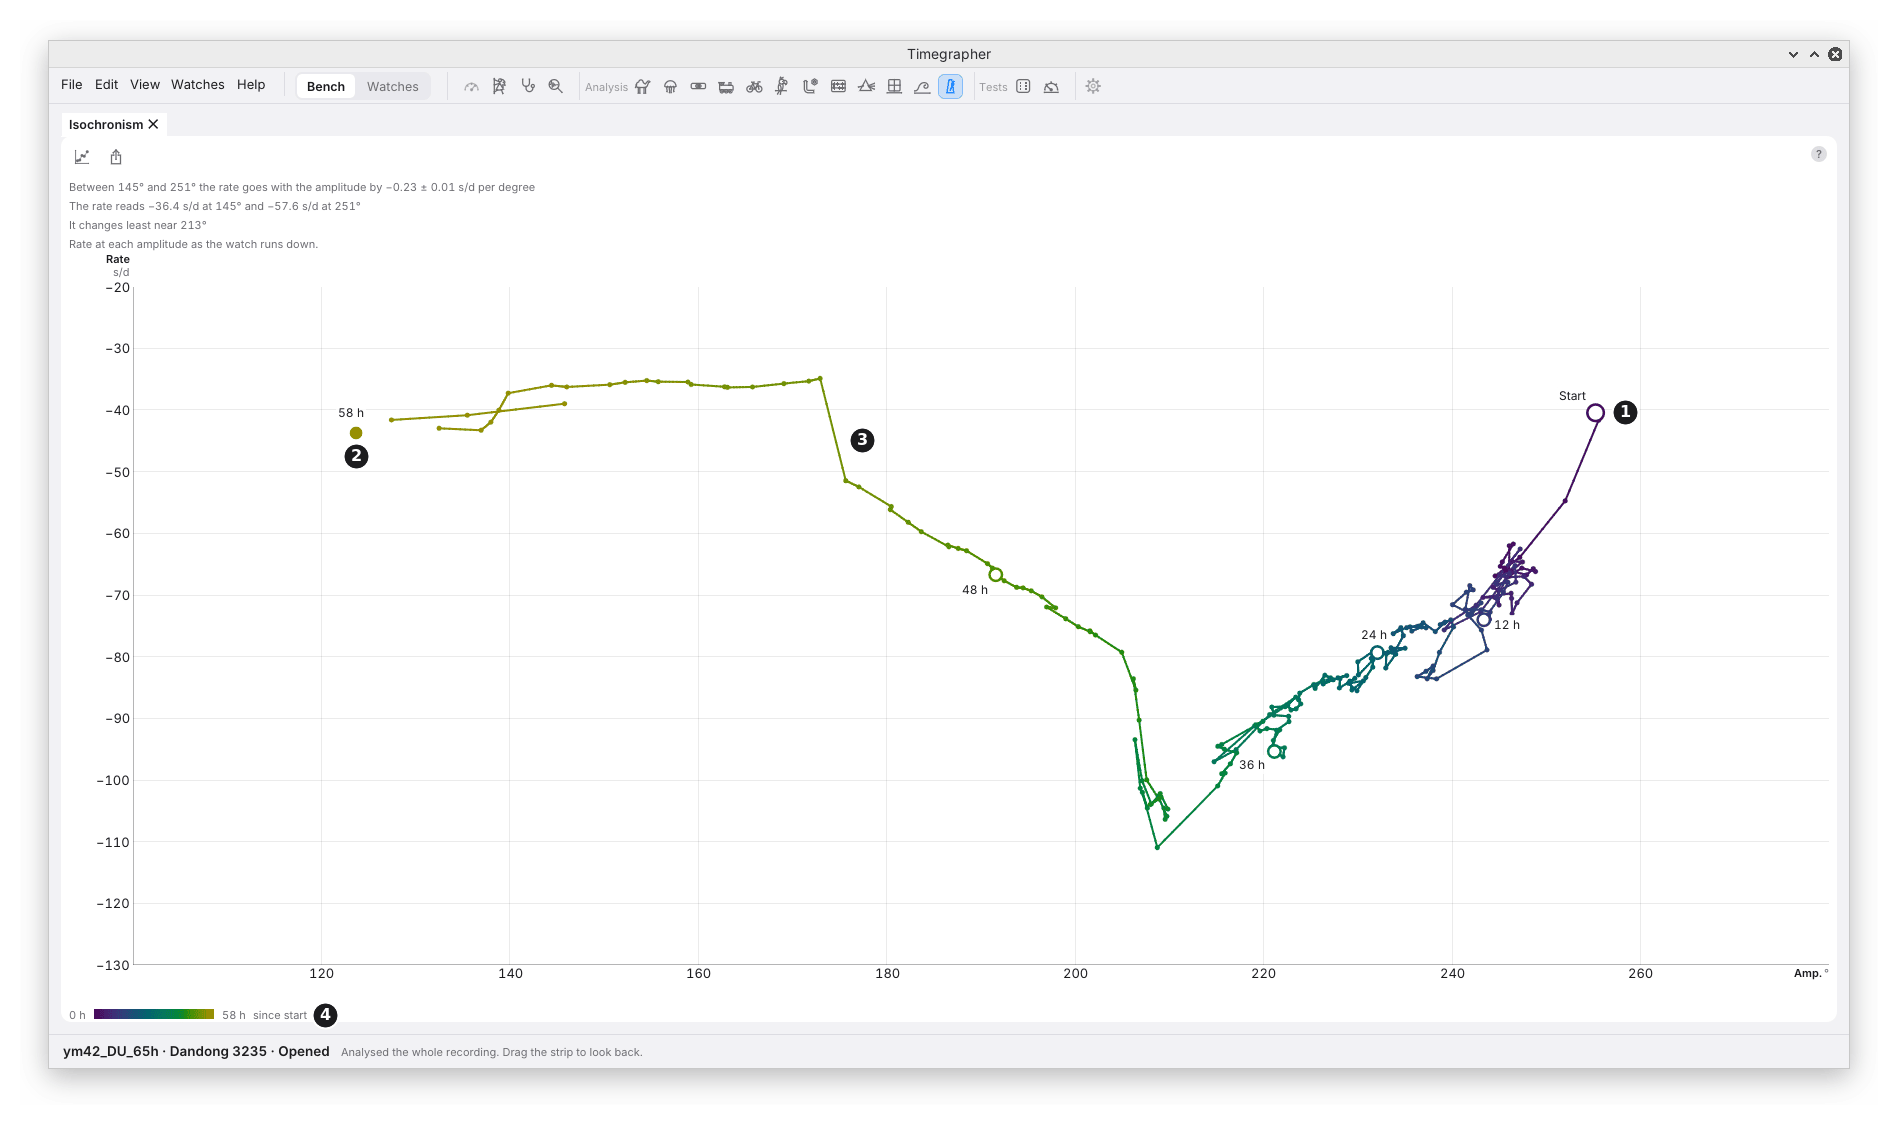
Walk keeps the time the curve leaves out: one dot for each 5 minutes (once a take has more than 250 such 5 minutes, about 20.8 hours without gaps, neighbours are joined, 10, 15 … minutes a dot, so there are at most 250), at its median rate and its median amplitude (on a long take, the mean of the joined 5 minutes’ medians), in time order, joined by a trail. Each dot is coloured by the hours since the take’s start, with a key. A ring marks the start, a large dot the end with its hour, and a ring each 12 hours (each 24 hours on a take over 96 hours). The trail breaks where a stretch was left out or the take broke. The pointer on a dot gives its time and figures.
| Mark | Part | What it shows |
|---|---|---|
| 1 | The start | A ring at the first 5 minutes, labelled “Start”. |
| 2 | The end | A large dot at the last, with its hour: “58 h”. |
| 3 | The trail | Dot to dot in time order, shading from each dot’s colour to the next’s. |
| 4 | The key | The colours from 0 h to the take’s end, “58 h since start”. |
In the picture, the watch starts at 255° and −40 s/d, top right, and for the first 44 hours walks down and to the left: less amplitude, a slower rate, the smooth part of the curve, with the 12 h, 24 h and 36 h rings along it. Then the walk turns twice almost straight up: near 207° (at about 44 hours) and near 174° (at about 51 hours) the rate gains 15 to 30 s/d while the amplitude hardly moves. Those jumps don’t follow the amplitude: something else changed the rate at those moments. A Curve view over the whole run, which has no time in it, would fold them in with the isochronism and bend the curve, which is why the picture above stops at 44 hours. From about 52 hours the rate holds near −36 s/d down to 140°, and the walk ends at 124° at 58 hours. Charts (chapter 8) and the Paper Strip show what happened at those hours.
Use it to see the path the watch took: a steady walk down in amplitude, a step after a knock, or a return to where it was. Both views span the same amplitudes, so a degree stays put when you switch.
How It Is Worked Out
- Rate against amplitude, reading by reading. Each 10 s rate reading is paired with the amplitude of its own 2 s windows.
- Steps of 2°, each needing at least 10 readings, between the 2nd and 98th percentile of the amplitudes, so a few stray readings don’t add steps of their own. At least 3 steps are needed.
- The slope is a straight line through every reading, none smoothed (a reading over 6σ from its neighbours’ median is left out first), corrected for the noise in the amplitude readings, with a ± that allows for correlated readings. It is withheld when that noise is half or more of their variance. M12 gives the method.
- The turn is where the quadratic is flattest, given when it falls in the middle 80% of the range.
- The walk takes the median rate of the 10 s readings and the median amplitude of the 2 s windows in each 5 minutes; a 5 minutes with under half of either is left out, never filled. Past 250 of them, neighbouring 5 minutes are joined, 10, 15 … minutes a dot, so there are at most 250.
What to Look For
| What you see | What it can mean |
|---|---|
| A flat curve | The rate barely moves with the amplitude over this range. |
| The rate rising as the amplitude falls | The watch gains at low amplitude. |
| The rate falling as the amplitude falls | The watch loses at low amplitude. |
| A turn inside the range | The amplitude where the rate is least sensitive. |
| A walk that doubles back | The amplitude rose again: a wind, or a change in the stand or the watch. |
What It Can’t Tell You
- The cause. The slope says the rate and the amplitude went together. Anything else that changed over the take, the temperature or the position, moves with them.
- Much on a short take. Over a few degrees, the curve is mostly noise. It is made for a run-down of many hours.
- A mix of positions. A take in several positions mixes them, and the pane says so.
- The wheel cycle. A cycle of a few minutes that moves the rate and amplitude together is in the Steadiness views (chapters 11 and 12), not here.
Until there are 5 minutes of beats in one position, the pane says so. The ? in its toolbar gives what it needs.
Previous: Wavelet Map · Next: Positions Test
This page comes from the app's user guide at v1.0.1. See it on GitHub.